Fig.1 - Marker counter for spectrum analyzers.
(VCO)
(SA)
(TG)
(HC)
(SN)
(MC)
(LCD)
(HOME)
Marker Counter for Spectrum Analyzers
Matjaz Vidmar, S53MV
1. Amplitude and frequency display
Spectrum analyzers are used to measure the frequency and amplitude of radio-frequency signals. Both quantities are at least roughly displayed on the CRT screen. When the spectrum analyzer only sweeps across a narrow frequency band, some additional frequency information is required to locate the narrow segment in the whole frequency range covered by the spectrum analyzer. Since the most popular amplitude display is 10dB/div, some additional accuracy is highly desired at least in a few interesting points on the CRT screen.
Older spectrum analyzers were equipped with a mechanical frequency dial. The dial accuracy was limited by the precision potentiometer used to set the current through the tuning coil of the YIG oscillator. The YIG-oscillator frequency is exactly proportional to the DC magnetic field, set by the current through the tuning coil.
The delicate and unreliable mechanical dial was quickly replaced by a digital milliampere-meter with three or four digits. The accuracy of this kind of frequency display is severely limited by the hysteresis of the core of the YIG magnet. It is sufficient to tune the spectrum analyzer first to zero, then move to the highest frequency and return back to zero to observe frequency errors as large as +/-20MHz!
An accurate frequency display only became possible recently with the availability of true microwave synthesizers including microwave prescalers. There are still many new spectrum analyzers on the market, including models with microprocessor control, that do not have a true frequency readout. Since only the current through the tuning coil is measured, their frequency readout relies on the linearity of the YIG tuning response.
All spectrum analyzers can be equipped with an external frequency counter. Since the circuit of a spectrum analyzer includes many frequency conversions, the frequencies of all local oscillators have to be measured and the result added to or subtracted from the last IF value. Further, the gates of the frequency counters need to be synchronized with the spectrum-analyzer sweep to measure the frequencies in a known point of the display.
The task of the frequency counter can be simplified with a tracking generator. The latter performs all required frequency summations and/or subtractions to obtain a signal on the exact frequency of operation of the spectrum analyzer. While using a tracking generator, the operating frequency of the spectrum analyzer can be measured with any frequency counter, provided that the spectrum analyzer is switched to zero span.
Modern spectrum analyzers with microcomputer-supported graphical displays can measure and display the frequency of one or more arbitrary points on the screen. These points are highlighted by well-visible markers on the screen. The frequency and amplitude of the signal at each marker are then displayed in numerical format as well.
The design of a suitable frequency counter displaying both frequencies and amplitudes of all markers allows many degrees of freedom and is almost independent on the type of the basic spectrum analyzer as well as auxiliary equipment (tracking generator, storage-normalizer). For a single-marker frequency measurement, a counter synchronized to the spectrum-analyzer sweep is sufficient. On the other extreme, a microcomputer-supported display is only limited by the performance of the microprocessor used to draw the picture.
A simple marker counter will be described in this article, designed to operate together with the spectrum analyzer [1] or [2] and corresponding tracking generator [3]. The tracking generator allows a simple frequency counter with a single input and a single prescaler. Of course, the gate of the counter is synchronized to the spectrum-analyzer sweep.
The block diagram of the marker counter for spectrum analyzers is shown on Fig.1. The circuit performs three functions: in the selected point on the screen it measures and numerically displays the frequency and amplitude of the signal and at the same time draws a marker on the oscilloscope display.
Fig.1 - Marker counter for spectrum analyzers.
The frequency counter includes three units: prescaler, counter and time base. The prescaler divides the input frequency by 256, allowing the use of a relatively slow counter. The counter module includes a decoder and driver for the four-digit, 7-segment LCD. The time base module provides a reset to the counter, opens the gate and stores the result for the LCD decoder/driver. A variable delay of the TRIG pulse coming from the spectrum analyzer selects the horizontal position of the marker where all measurements are done.
The video-signal sampler is triggered at the same time as the frequency counter. The video-voltage sample is stored in a capacitor and displayed on a digital voltmeter. The scale of the latter is calibrated directly in decibels. An additional front-panel command allows an arbitrary offset of the decibel scale.
Finally, the same MARKER pulse drives the circuit that actually adds the marker to the video signal. The marker module includes a 455kHz oscillator. The output of the latter is added to the Y-VIDEO signal, adding a short vertical line at the marker position on the oscilloscope display
Since spectrum analyzers are sensitive radio receivers, the marker counter is installed in its own shielded case. Metal shielding is sufficient in most cases, even with a short whip antenna installed directly on the input connector of the spectrum analyzer. Of course, if interference from the marker counter or tracking generator is suspected, either or both can be simply turned off. The circuits of the marker counter are therefore designed not to disturb the Y-VIDEO and TRIG signals in the power-off state.
2. Prescaler
The tracking-generator output frequency ranges almost from DC up to a few GHz. A high-speed prescaler is required to measure very high frequencies. On the other hand, a prescaler slows down the operation of the counter. Therefore, the divider modulo of the prescaler is not arbitrary.
In the case of a spectrum analyzer, there is not much time to measure the frequency. The frequency measurement should be shorter than the time of one complete sweep, usually around 20ms. The resolution of the frequency counter is therefore limited to 100kHz. The latter requires 2.56ms when using a divide-by-256 prescaler. A better frequency resolution could only be obtained by averaging several measurements in consecutive sweeps of the spectrum analyzer.
An additional difficulty is represented by the zero on the frequency scale. The operation of the tracking generator is quite uncertain at very low frequencies. The prescaler is even less reliable at very low input frequencies. Accurate frequency measurements around zero can only be obtained by measuring the frequencies of all variable oscillators in the spectrum analyzer and then computing the final result according to the conversions used in the spectrum analyzer.
The lower frequency limit for the tracking generator shown in [3] is about 100kHz. The latter is a very low frequency for ECL prescalers. Inexpensive prescalers for TV receivers are only designed to operate above about 70MHz. The extension of the prescaler frequency range to very low frequencies requires careful input signal processing.
Inexpensive prescalers U664 and U891 were first tried in the described circuit. Their upper frequency limit is about 1.6GHz and is very sensitive to chip tolerances and ambient temperature. It can be somewhat improved using a higher-than-nominal supply voltage. Unfortunately both the U664 and U891 will hardly operate correctly below 20MHz, probably due to some capacitive coupling inside the prescaler chip itself.
Fortunately prescalers from other manufacturers did not show the same behavior at very low input frequencies. Much better results were obtained with the SDA4212. The latter operates up to 1.8GHz at room temperature. On the other hand, its lower frequency limit can be extended to less than 1MHz with suitable input signal processing. Both limits compare favourably with the requirements of the spectrum analyzer described in [1] or [2].
The circuit diagram of the whole prescaler is shown on Fig.2. The input amplifier INA03184 is mainly required at low frequencies to transform the input sinewave into a squarewave for the ECL prescaler. Even more important is the limiter with the BAT14-099R schottky quad. The latter both shapes the signal and prevents saturating the input of the SDA4212.
Fig.2 - Prescaler.
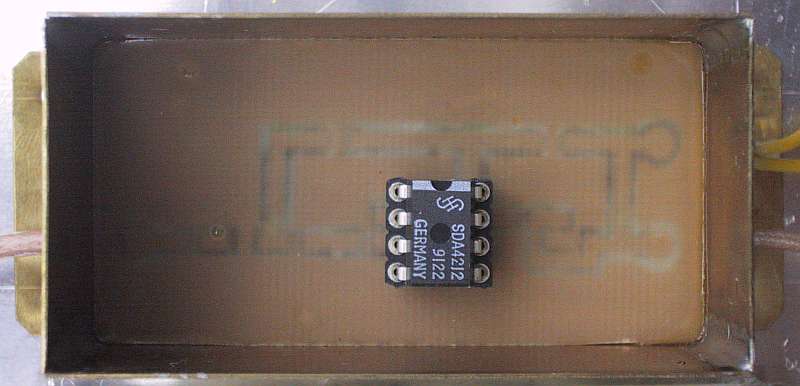
The SDA4212 prescaler has a standard pinout. The U891 could be used in the same socket, except for limiting the frequency coverage from 20MHz to 1.6GHz. The output signal of the ECL prescaler is amplified by the BFP183 transistor to TTL logic levels.
Most ECL prescalers allow some selection of the divider modulo with pin 5. A divider modulo of 256 was selected since it is available in most prescalers. Dividing by 256 provides an output frequency up to 7MHz at an input of 1.8GHz. Since the following counter allows input frequencies up to 16MHz, the same circuit could directly count both VCO frequencies with faster prescalers like the uPB1505.
The prescaler module requires a single supply voltage +5V. All components are SMD types except for the SDA4212. Experiments have shown that the SDA4212 operates better while inserted in a good-quality IC socket rather than being soldered directly to the circuit board. It seems that the socket contacts provide some additional impedance matching for the SDA4212.
3. Counter
A digital counter is the most obvious component of a digital frequency meter. Of course the content of the counter has to be memorized and displayed at the end. Most frequency counters are equipped with 7-segment LED displays. The latter have a large current consumption leading to generation of large amounts of heat and radio-frequency interference. Both of the latter are highly undesirable in a sensitive piece of test equipment like a spectrum analyzer.
On the other hand, liquid-crystal displays have a low power drain and generate little radio-frequency interference. Multiplexed LCD modules with integrated drivers and controller are certainly the easiest to use. Unfortunately, due to the LCD multiplexing, their contrast is poor and it is relatively difficult to get such displays with large characters.
The described frequency counter is therefore designed around an unmultiplexed LCD with four large digits as used in table clocks. A suitable counter, memory, 7-segment decoder and LCD driver is available in a single integrated circuit ICM7224IPL. With the latter, a number of 40xx or 74HCxxx integrated circuits or a programmed microcontroller are no longer necessary.
The connection of the ICM7224IPL is shown on Fig.3. The counter section is controlled through the inputs COUNT and /COUNT-INHIBIT. The COUNT input is driven by the prescaler. The /COUNT-INHIBIT input enables or stops the counter. On the other hand, any level transitions on the /COUNT-INHIBIT input will not advance the counter inside the ICM7224IPL as long as the COUNT input does not toggle. The content of the counter is copied to the memory with a low pulse on /STROBE. Finally, the counter is reset to zero with a low pulse on /RESET.
Fig.3 - Counter.
Since the LCD is not multiplexed, each segment on the display requires its own connection to the ICM7224IPL. The latter is also driving the backplane (BP) electrode common to all segments. In this way the display driver always applies an alternate voltage of a few tens or hundreds Hz to the LCD. The LCD frequency is provided by an internal oscillator inside the ICM7224IPL.
The ICM7224IPL and the LCD have a few unconnected pins, like the decimal points of the LCD. The ICM7224IPL could even drive a fifth digit (segment AB5) that is not available in the LCD used in this project. On the other hand, the /CARRY output allows the concatenation of several ICM7224IPL and corresponding displays. The LZBIN input and LZBOUT output allow correct leading-zero blanking when several ICM7224IPLs are concatenated. In the described circuit the LZBIN input is not connected, since it is kept in the correct logic state by an internal resistor.
The ICM7224IPL requires a single supply voltage +5V. At +5V supply the counter section is able to operate correctly up to 15...25MHz. In order to save space on the front panel of the marker counter, the ICM7224IPL is installed below the LCD. The single-sided printed-circuit board requires two jumpers (Vdd and BP) below the ICM7224IPL.
4. Time base
Since the marker counter has to be synchronized to the spectrum-analyzer sweep, the design of its time base slightly differs from conventional frequency counters. Besides the synchronization with the spectrum analyzer, the time required by the frequency measurement itself should be considered. If the spectrum-analyzer sweep is reasonably linear, the counter measurement will correspond to the frequency in the center of the measurement interval.
Besides steering the counter gate, memory and reset, the time base also provides MARKER pulses to other circuits to sample the video signal and draw a marker on the corresponding point on the screen. Of course the MARKER pulse should be generated exactly in the center of the counter gate pulse fed to /COUNT-INHIBIT.
The circuit diagram of the time base is shown on Fig.4. The TRIG pulse from the spectrum analyzer resets the counter and triggers the first monostable (first half of first 74HC4538). The latter produces a variable delay to adjust the marker position. After the first monostable times out, the second half of the same 74HC4538 produces a microsecond pulse.
Fig.4 - Time base.
The microsecond pulse starts the time base by resetting the flip-flop in the second 4518 (pins 10, 11 and 15). The flip-flop releases the time-base divider including a 74HC4040 and another 4518, driven by a 10MHz crystal oscillator. The divider produces either 31.25kHz or 3125Hz according to the desired counter gate time for 1MHz or 100kHz resolution.
The decade counter in the second 4518 (pins 2, 5 and 6) waits in the state "8". The incoming clock will move the decade counter to 9, 0, 1, 2, 3, 4, 5, 6, 7 and back to 8. When the state "8" is reached, the flip-flop is triggered and the time-base divider is blocked. The output /COUNT-INHIBIT is enabled between states 0 and 7 for a total of 8 clock periods or 256us (resolution 1MHz) or 2.56ms (resolution 100kHz). After the counter gate is closed, a ten microsecond pulse /STORE is generated to copy the counter content in the display memory (second half of second 74HC4538).
In the middle of the counter-gate period, on the transition from state 3 to state 4 of the decade counter, the first half of the second 74HC4538 is triggered to produce the MARKER pulse. The MARKER pulse width is set to about 30 microseconds to produce a well-visible marker on the oscilloscope screen as well as drive the video-signal sampler.
The time base requires a single supply voltage +5V. The latter also requires a wire jumper under the second 74HC4538 on the single-sided printed-circuit board. All control signals for the counter (/RESTE, /COUNT-INHIBIT and /STORE) are available on a single connector including +5V and ground. The TRIG input is protected with diodes and resistors also in the case when the marker counter is powered off.
5. Sampler
While the amplitudes of all displayed signals can be read easily from the spectrum-analyzer screen, an additional digital display of the signal amplitude at the marker position is always welcome. The spectrum analyzer presented in [1] or [2] has an analog Y-VIDEO output providing 20dB/V. Of course the Y-VIDEO output changes a lot during a single sweep across the screen. To measure the signal level at the marker position, the Y-VIDEO signal has to be sampled at the appropriate point in time.
The circuit diagram of the video-signal sampler is shown on Fig.5. The video signal is first fed through a simple low-pass (22kohm, 68pF) to the voltage follower with the first CA3140 op-amp. The CA3140 avoids loading the video-signal line in all cases: when the sampler is operating and in the power-off condition. The 7V5 zener diode is used to protect the MOS input of the CA3140.
Fig.5 - Sampler.
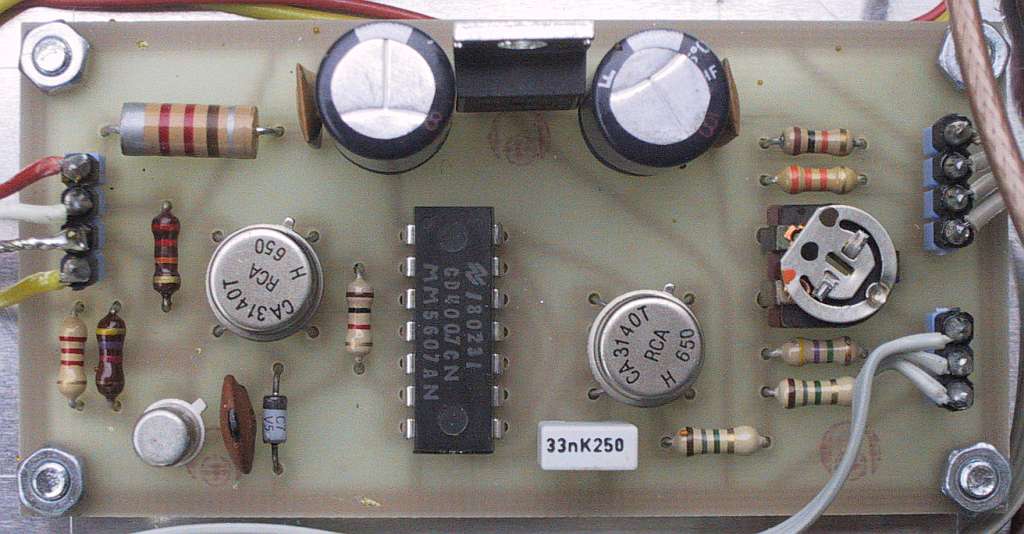
The sampler includes a transmission gate (built with the MOS transistors contained in the 4007) and a 33nF capacitor. The CMOS transmission gate is turned on only for a very short period by the MARKER pulse, amplified by the 2N2369 transistor to CMOS logical levels. The 33nF capacitor then holds the sampled voltage, followed by another MOS voltage follower with the second CA3140 op-amp.
The CA3140 operational amplifiers have many desirable features. Besides a very high impedance of the MOS inputs, their input and output voltage ranges go down to the negative supply rail. The latter feature allows a single positive supply +12V for the op-amps. The CA3140 also withstands large overloads on the inputs, up to +8V above the positive supply rail. The latter prevents damage to the op-amp in the power-off condition.
The 4007 was selected as the sampling switch because of repeatability. More common CMOS transmission gates like the 4016 or 4066 may have very different electrical performances when supplied by different manufacturers.
The output voltage can be displayed in many different ways. The simplest solution is to use a digital-voltmeter module (DVM) with a similar non-multiplexed LCD as used in the frequency counter. While DVM modules are cheap and easily available, the corresponding user manual usually requires to have the power supply isolated from the measured voltage.
The requirement for the isolated supply for the DVM module can be overcome easily by studying the internal circuit diagram of the DVM. Most DVM modules with a 3-1/2 digit LCD are built around the integrated circuit ICL7106CPL as shown on Fig.6, including those with an unmarked, bare chip bonded directly to the printed-circuit board. Some additional components may be included in some DVM modules to drive the decimal points on the display.
Fig.6 - DVM.
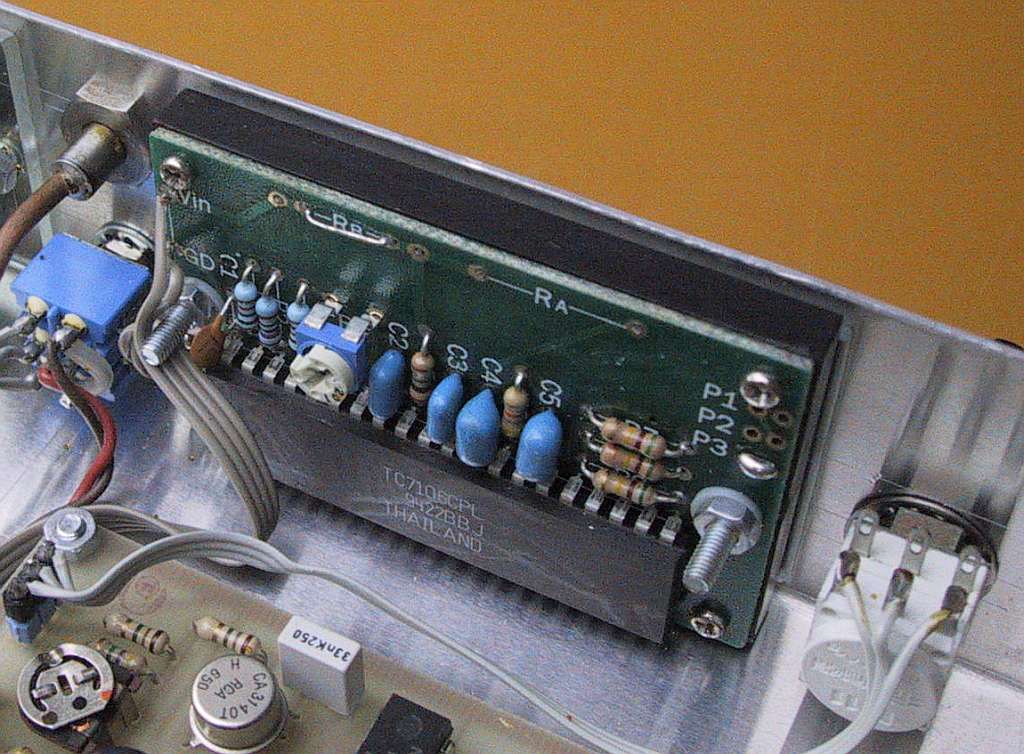
The nominal DVM-module supply voltage is a 9V battery connected between +BAT and -BAT. Internally the ICL7106CPL includes a precision regulator for the 2.8V reference voltage between +BAT and COMMON. Besides being used as a source for the reference voltage between REFLO and REFHI, the regulator also provides a virtual ground called COMMON for all the analog circuits inside the ICL7106IPL. One of the voltmeter inputs (usually INLO) is connected directly to COMMON already inside the DVM module.
The sampler circuit board includes a 7808 regulator to supply the DVM module with +8V on +BAT, while -BAT is connected to ground. In this case COMMON is held at about +5.2V. While designing additional circuits around the DVM module, one should consider that the internal regulator inside the ICL7106CPL can only sink current from COMMON (load between COMMON and +BAT).
DVM modules are usually designed for a full-scale sensitivity of +/-200mV. A resistive voltage divider is required to measure higher voltages, so that the voltage between INPUT and COMMON remains within the +/-200mV range. If the resistive divider pulls current from COMMON, then an additional load from COMMON to +BAT is required, like the 10kohm resistor on Fig.5, to prevent any current being sourced from COMMON.
Since the Y-VIDEO signal is logarithmic 20dB/V, it makes sense to calibrate the DVM scale directly in dB (or tenths of dB). A 0.1dB change in the signal level is represented by a 5mV change in the Y-VIDEO signal. The latter should be divided by 50 to match the DVM steps of 0.1mV (3-1/2 digit full scale +/-200mV). The exact divider ratio is set by the 10kohm trimmer SCALE. The front-panel command OFFSET allows adding an arbitrary offset to the sampled Y-VIDEO value.
The sampler requires an unstabilized supply of +12V for both CA3140s and the 4007. The DVM and OFFSET potentiometer are supplied by the 7808 regulator. The Y-VIDEO input is designed to represent a high-impedance load both during power on and power off.
6. Marker
Numerical frequency and amplitude displays are of little value if it is not known to which signal they refer to. The simplest way to indicate the measured signal is to draw a well-visible marker in the corresponding place on the spectrum-analyzer display. The marker can be drawn in many different ways depending on the accessible signals driving the cathode-ray tube or other display device: vertical (Y) deflection only, both vertical and horizontal (XY) deflection and/or beam intensity (Z).
In the most general case only the vertical (Y) deflection is available. The marker pattern should therefore be added to the Y-VIDEO signal. Of course the marker pattern should be selected in such a way that it is not confused with the typical patterns displayed by the spectrum analyzer. At the same time, the marker pattern should not corrupt much of the information contained in the Y-VIDEO signal.
The marker circuit shown on Fig.7 generates a short vertical line as the marker pattern. The latter extends both above and below the actual trace generated by the spectrum analyzer. The line pattern is generated by adding a few oscillations of a sinewave 455kHz oscillator to the Y-VIDEO signal.
Fig.7 - Marker.
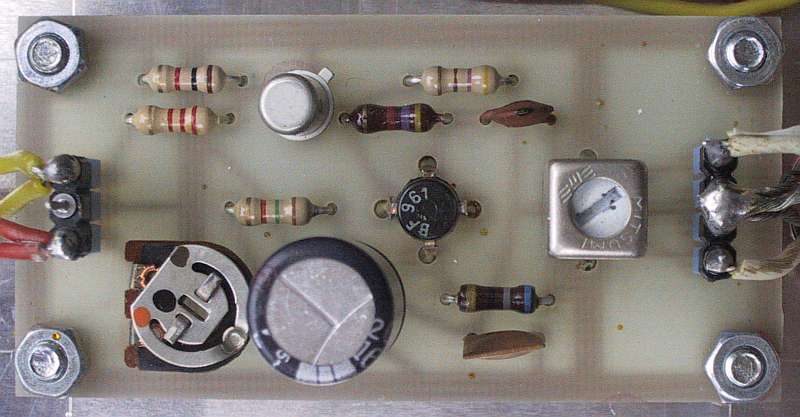
The 455kHz oscillator includes a BF961 MOS transistor as the active device and an IF transformer (white core or AM2) as the selective feedback. The MOS transistor allows both a fast startup of the oscillator as well as a fast shutdown after the power is removed. The 470ohm resistor across the oscillator supply speeds up the shutdown.
The oscillator output is added to the Y-VIDEO signal through the secondary winding of the IF transformer. The circuit is designed to obtain a pattern height of about one division or 0.5Vpp while using a standard IF transformer for 455kHz. When the marker circuit is powered off, the 470ohm resistor loads the primary of the IF transformer so that the circuit has no effect on the Y-VIDEO signal.
The oscillator is turned on or off by the 2N2369 transistor. The marker pattern height is set by the supply voltage with the 10kohm trimmer. Since the duty cycle of the oscillator operation is very low, its supply current comes from the 220uF capacitor. The latter is then slowly recharged through the rest of the cycle through the trimmer and 1.5kohm resistor. Since the +12V supply is not stabilized, the marker height may change slightly with the supply voltage.
7. Assembly of the marker counter
The marker counter is built in the same way as the corresponding spectrum analyzer [1] or [2] and tracking generator [3]. The +5V supply comes from a 7805 regulator as shown on Fig.8. To save some space on the front panel, a three-position switch is used to select the counter resolution (1MHz or 100kHz) or to turn the marker counter off.
Fig.8 - Power supply.
The marker counter includes a single RF printed-circuit board for the prescaler, built with SMD components and shielded in a box of 0.5mm brass sheet with the dimensions of 30mmX60mmX30mm. The prescaler circuit board is shown on Fig.9 and is etched on single-sided, 0.8mm thick glassfiber-epoxy laminate FR4.
Fig.9 - Prescaler circuit board (30X60, 150dpi).
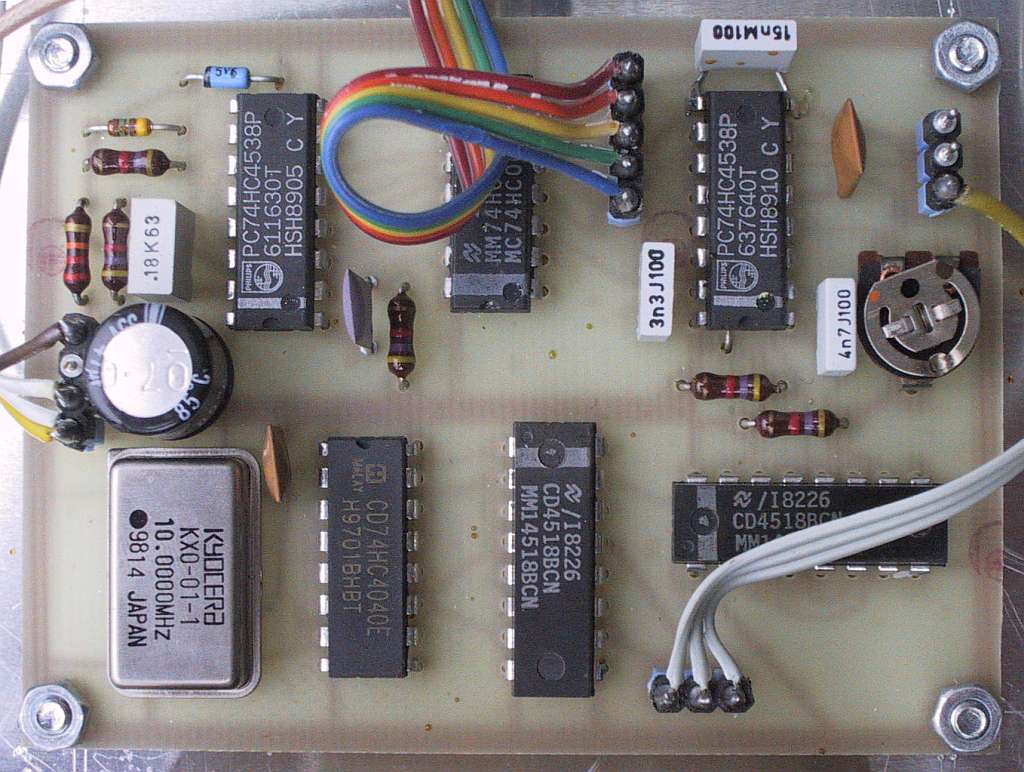
All other circuit boards only carry low-frequency circuits built with standard components with wire leads. The circuit boards are shown on Fig.10 and are all etched on single-sided, 1.6mm thick glassfiber-epoxy laminate FR4. The single-sided boards require a few wire jumpers: two jumpers under the ICM7224IPL in the counter module and one jumper under the second 74HC4538 in the time base. The DVM module is usually available already built, so no special circuit board is required.
Fig.10 - Other (low-frequency) circuit boards (150dpi).
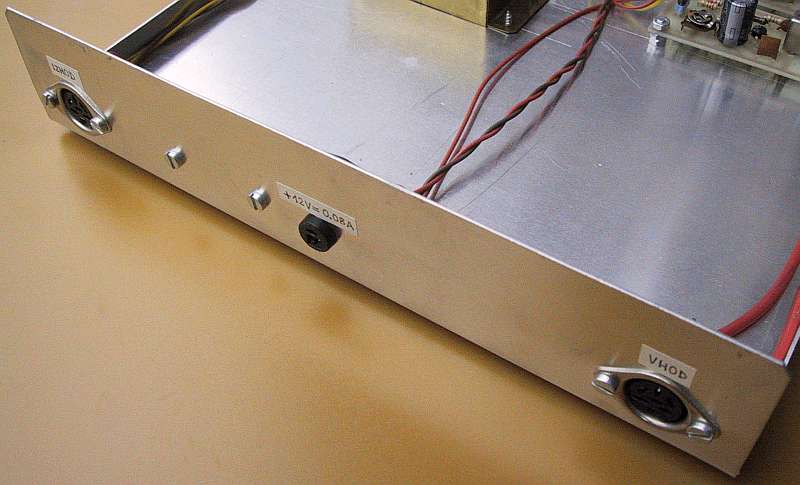
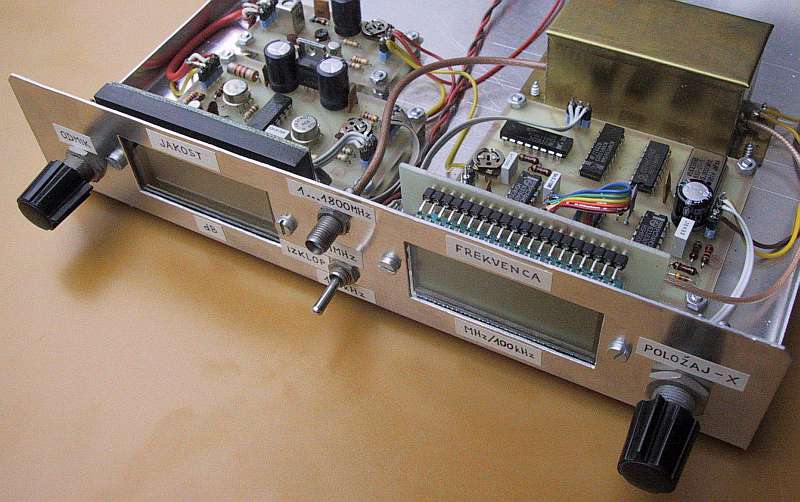
The marker counter module location is shown on Fig.11. The marker counter has the same depth (240mm) and width (220mm) as the spectrum analyzer [1] or [2]. The height is set to 42mm by the available DVM module and counter LCD. The bottom of the box is simply a piece of 1mm thick aluminum sheet, bent in the form of an "U". The cover is a similar "U" made from 0.6mm thick aluminum sheet.
Fig.11 - Marker-counter module location.
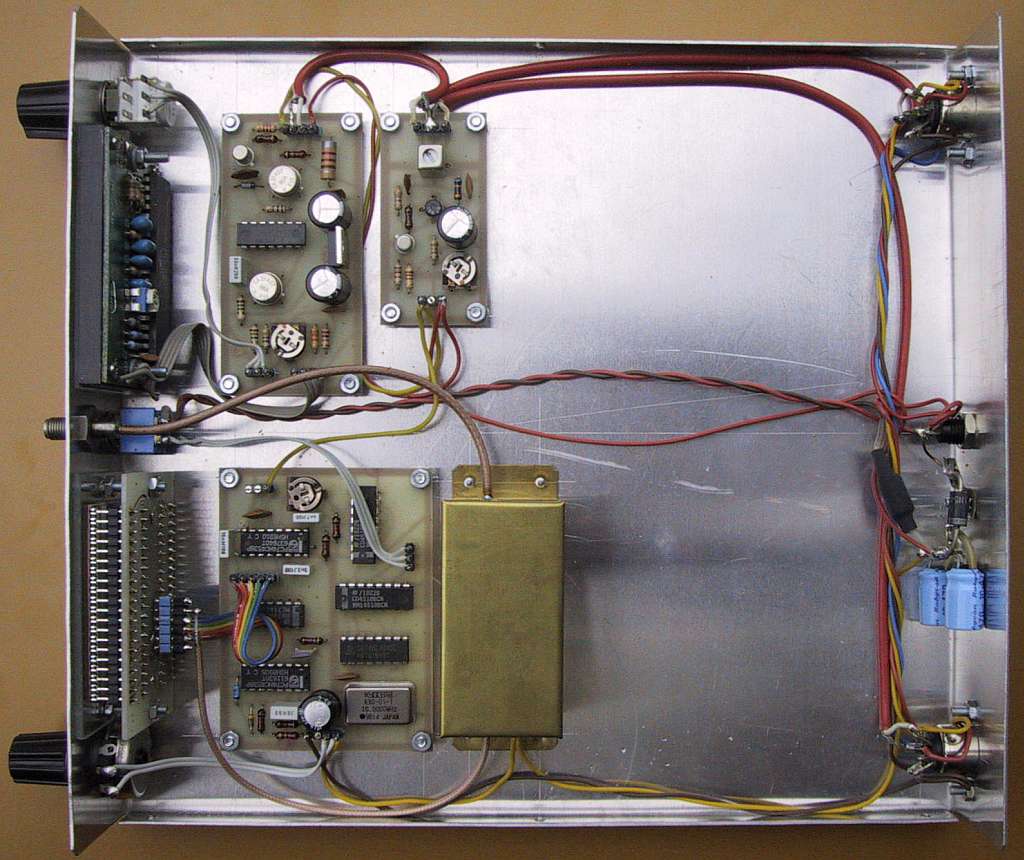
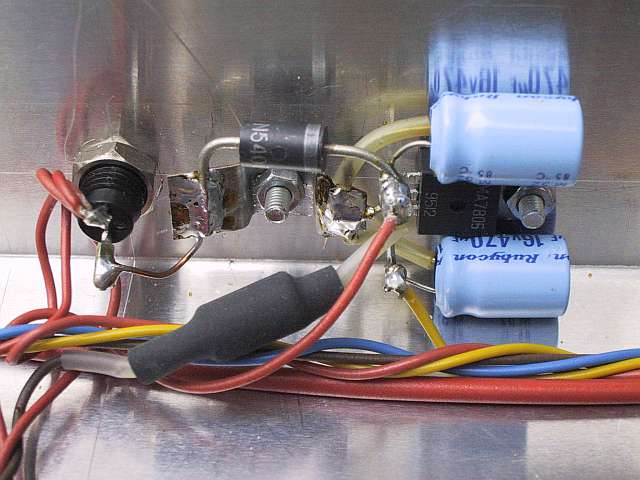
The 7805 regulator is bolted to the back plate for heatsinking purposes. The two 470uF electrolytic capacitors, VK200 RF choke and 1N5401 diode are simply soldered between the +12V supply connector and the leads of the 7805 regulator. The overall current drain amounts to about 80mA. The empty space in the box of the marker counter could be used for further additions like a computer interface.
The marker counter is a relatively simple piece of equipment that should operate without any tuning. Some settings are self evident, like the marker height and width. If no marker can be obtained, the tap on the primary of the IF transformer may be too far from the center of the winding and the oscillator may not work at all.
The accuracy of the counter is defined by the 10MHz crystal oscillator. While checking the frequency counter, both the lower and upper frequency limits have to be tested. If the frequency counter displays strange symbols on the LCD at particular counts, then a 15nF capacitor has to be added from /STORE to ground (see Fig.4).
Finally, the scale of the DVM has to be set correctly so that the display is calibrated in decibels. The easiest way is to use the SCALE trimmer in the sampler module and a calibrated step attenuator between the tracking-generator RF output and spectrum-analyzer RF input.
The connection of the decimal points of both LCDs may not be simple, since the active LCD segments should only receive an AC voltage. Any DC component might damage the LCD through electrolytic processes. Some cheap DVM modules have jumpers that connect the decimal points to the COMMON pin of the ICL7106CPL. Due to the lower amplitude, the contrast of the decimal points may not be as good as that of the regular seven segments. In a similar way, the decimal points of the counter display may be turned on by connecting them to ground through
a suitable capacitor.
Original full-size drawings

References:
[1] Matjaz Vidmar: "Spectrum analyser 0...1750MHz", pages 2-30/1-99, VHF-Communications.
[2] Matjaz Vidmar: "Spektrum-Analyzer von 0 bis 1750MHz, Teil 1: Aufbau der Baugruppen", pages 18-30/4-99, "Spektrum-Analyzer von 0 bis 1750MHz, Teil 2: Anzeigebaugruppen und Abgleich", pages 18-29/1-00, AMSAT-DL Journal.
[3] Matjaz Vidmar: "Tracking Generator for the Spectrum Analyser 100kHz to 1750MHz", pages 66-79/2-99, VHF-Communications.
* * * * *